

Announcing Forecast 2026 Report …
You don’t have to wait to find out.
I am projecting a major stock market BUYING OPPORTUNITY in 2026.
This isn’t speculation—it’s backed by proof. My forecasts for 2023, 2024, and 2025 were published in advance and have already demonstrated the power of stock market cycles.
Figure 1: 2025 Natural Cycle Forecast DJIA
(Chart 13 in Forecast 2025 Report)
Figure 1 was my natural cycle forecast for 2025 from page 16 of my report. Helpful?
Was this just luck? Perhaps, so why not look at my forecast for 2024 and 2023 shown here with what the Dow (DJIA) did vs the forecast.
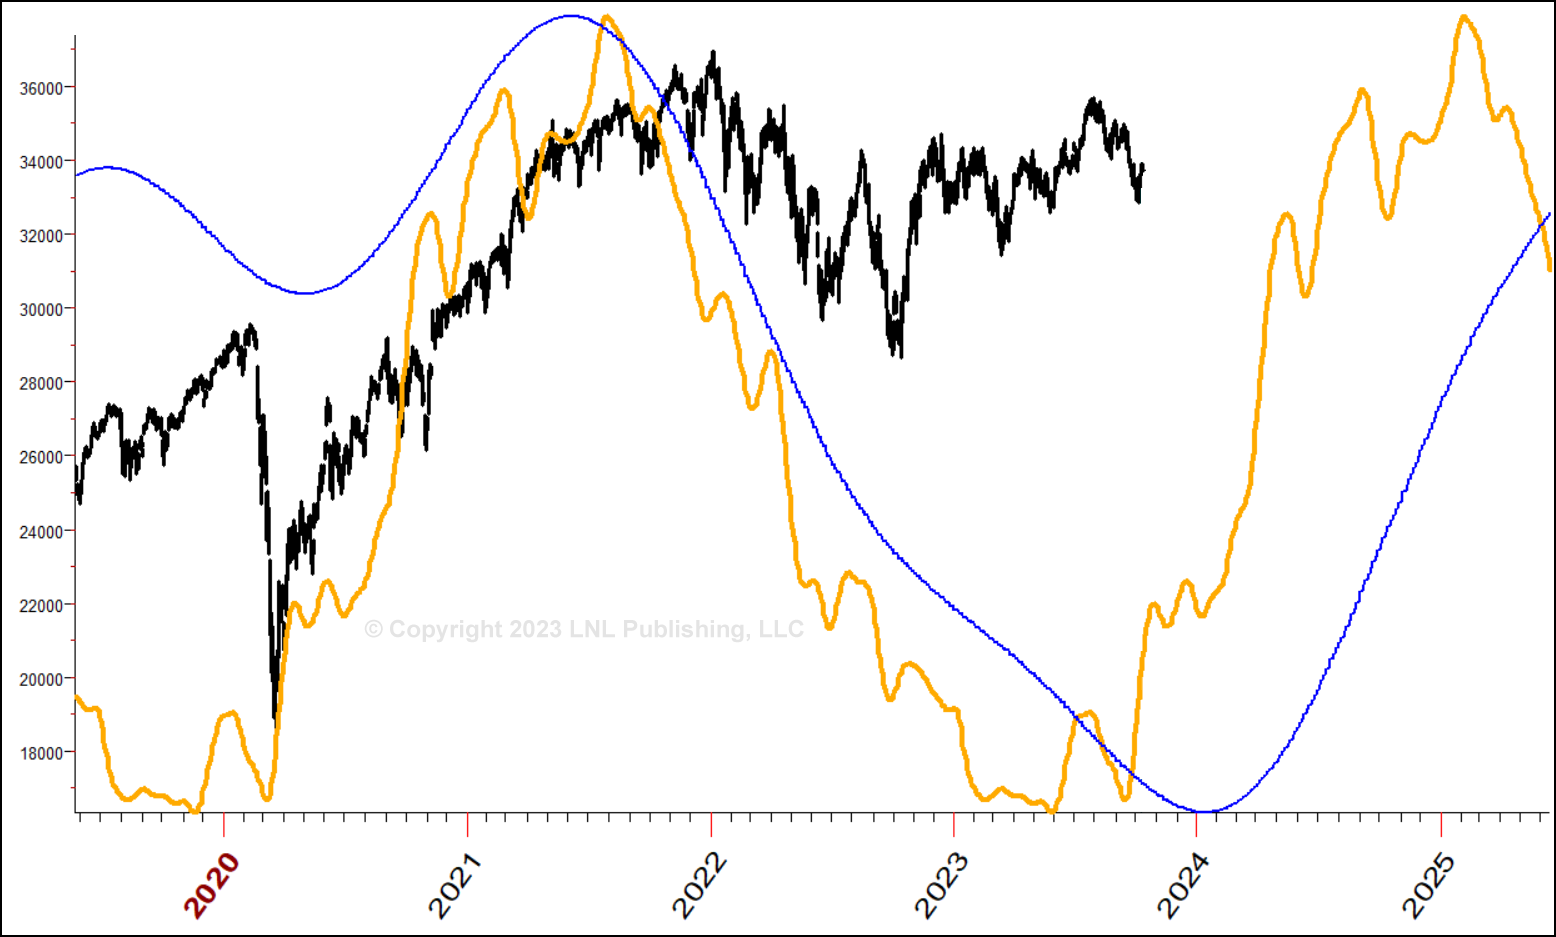
Figure 2: 2024 Cycle Projection with Price
(Chart 17 Forecast 2025 Report)
Figure 2 was my cycle forecast for 2024 in blue and gold with how it actually came out.
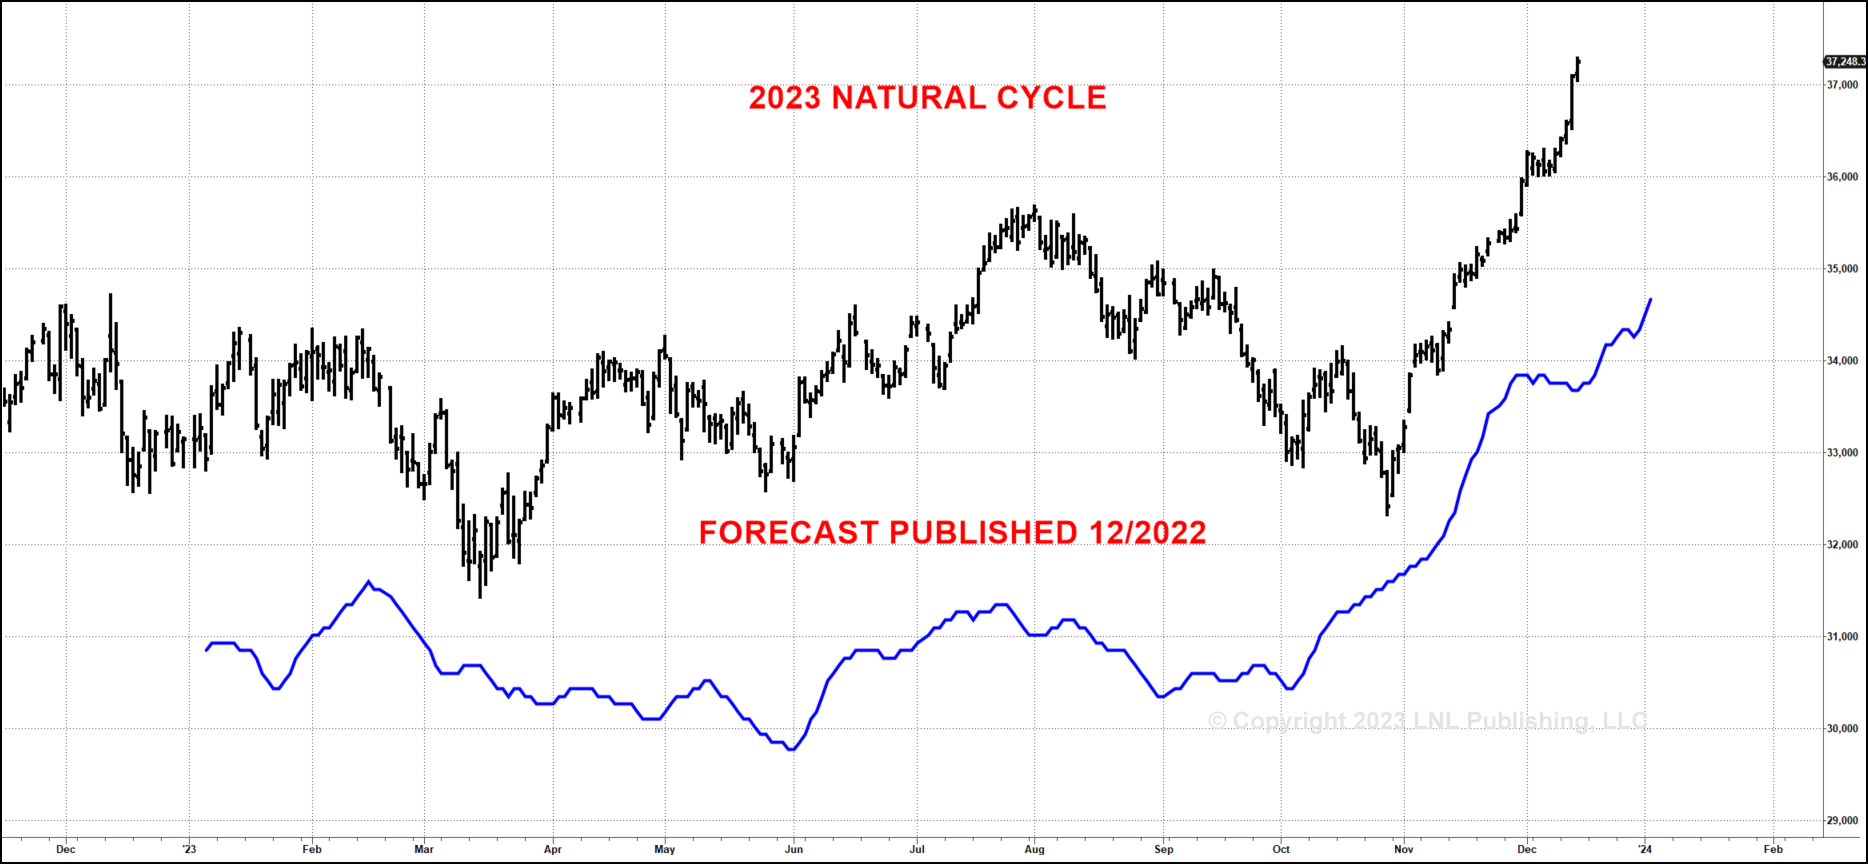
Figure 3: 2023 Natural Cycle Forecast
(Chart 12 in Forecast 2025 Report)
Figure 3 was my natural cycle forecast for 2023 in blue—side by side with how it actually played out.
I’ve spent a lifetime learning how to forecast the future of markets starting in 1962.There were false starts, dead ends, and plenty of lessons along the way. But over time, I uncovered the cycles and patterns that truly drive markets. What you see here is proof: forecasting isn’t magic, it isn’t perfect—but it is a reliable roadmap you can follow.
2025 Results
You will get:
Some say forecasting is just “hooey.” But not Jim Cramer—he’s featured my forecasts for years on Mad Money. On StockCharts.com hundreds of thousands have seen my work. As well as the countless viewers on YouTube who’ve watched my forecasts play out.
Now, for the first time, you can gain exclusive personal access to my 2026 forecasts—insights that will not be revealed to the public.
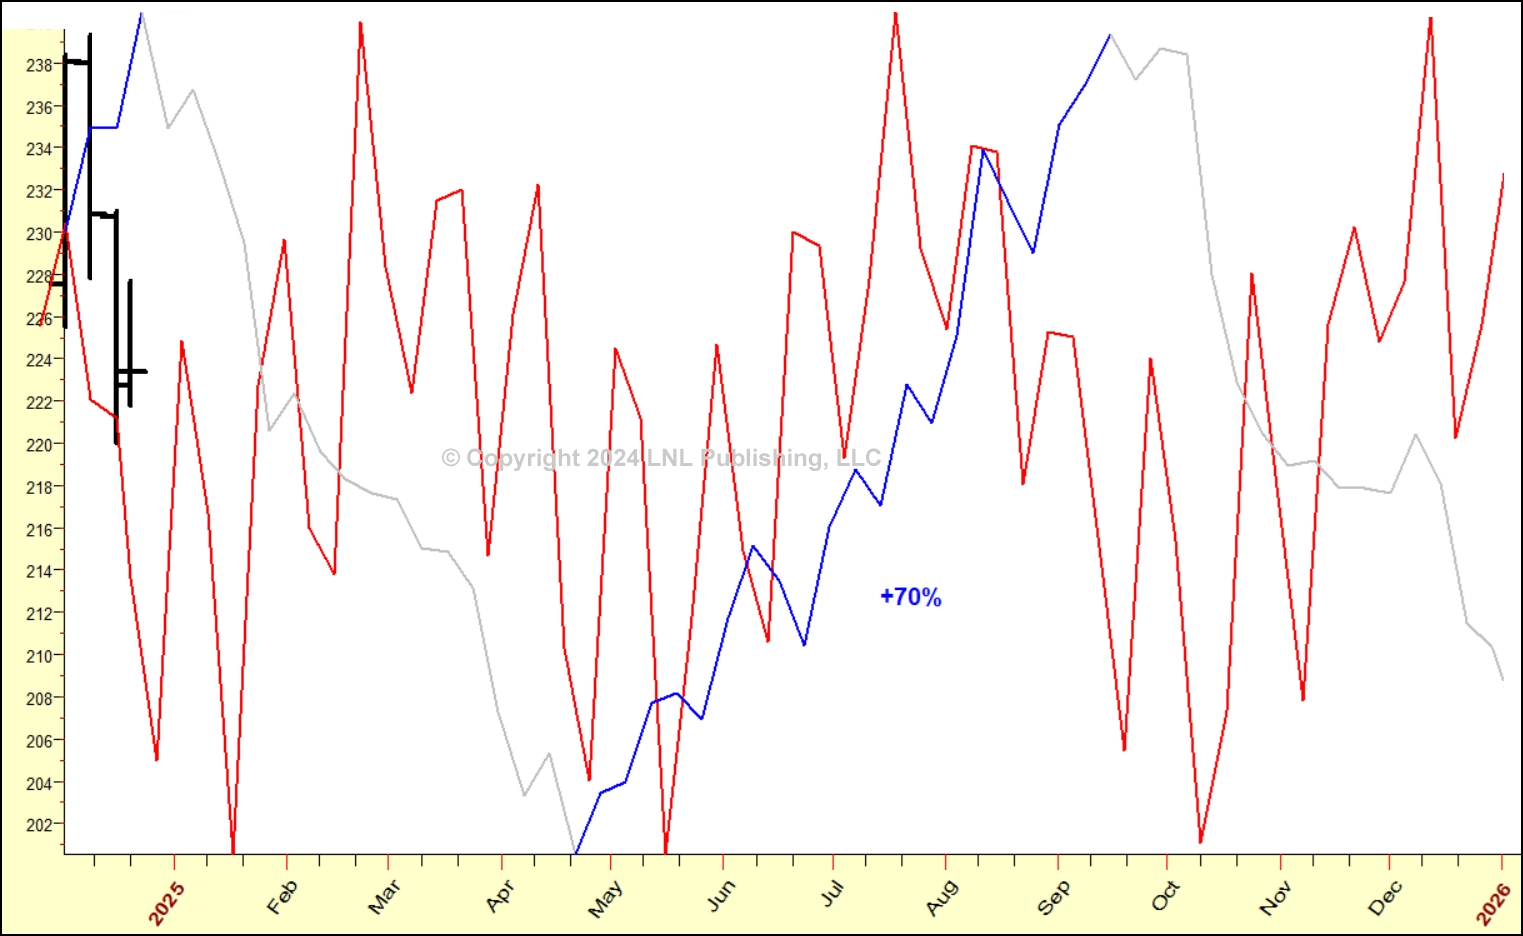
Figure 4: 2025 International Business Machines IBM
(Chart 124 in Forecast 2025 Report)
Figure 4 is 2025’s forecast for IBM. Quick, get your charts to see how this actually panned-out.
I’m sharing two charts with you so you can determine which one helps you the most.The first is the view 99.9% of traders have for COSTCO for 2026. Take a look. Is it helpful?
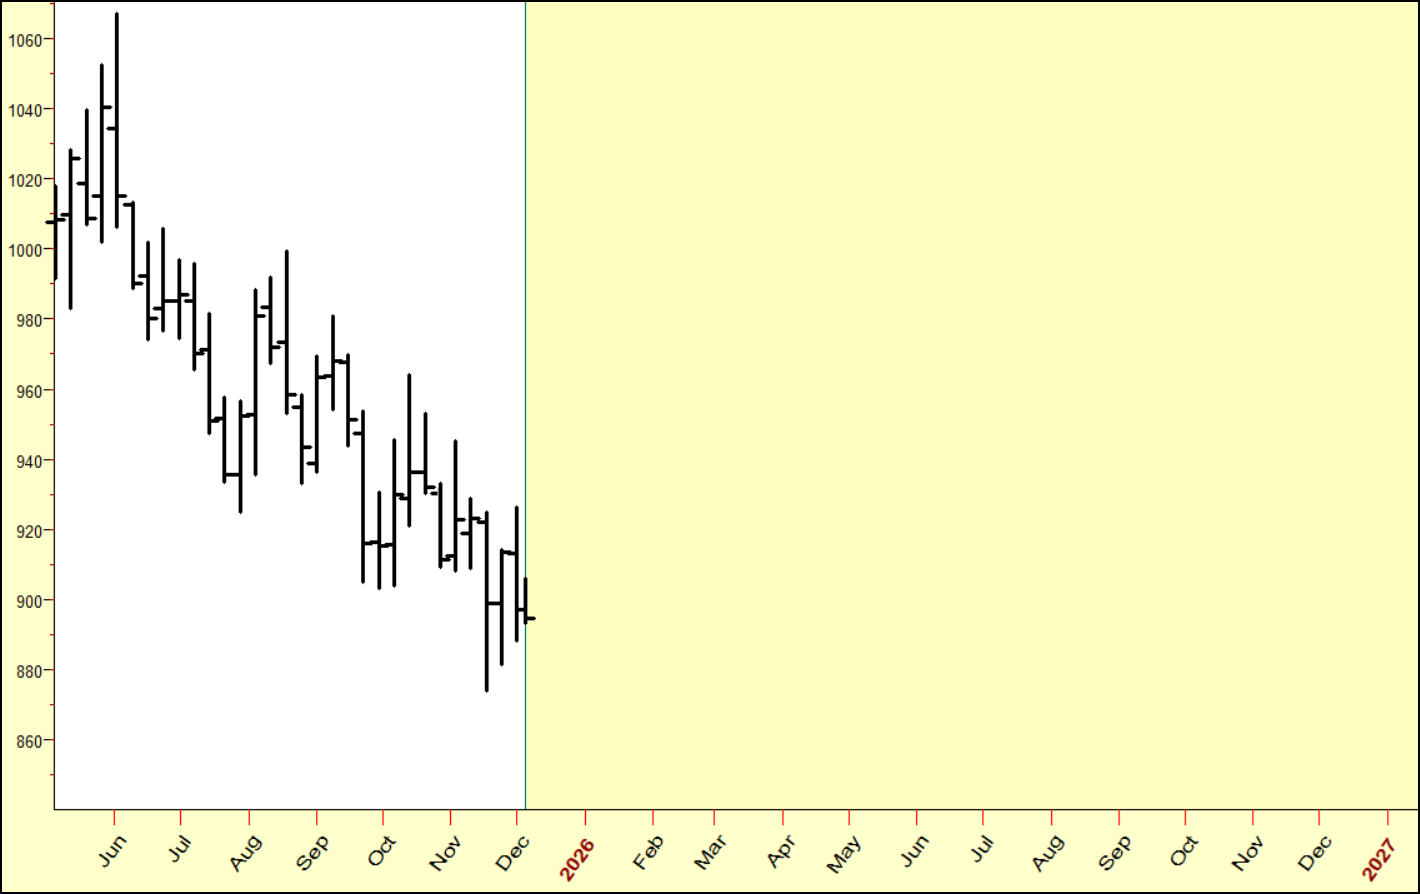
Figure 5: 2026 COST Forecast Most Traders See
Then look at the next chart, my 2026 forecast for Costco (COST). This view—advanced knowledge—for trading and investing can be yours for 2026.
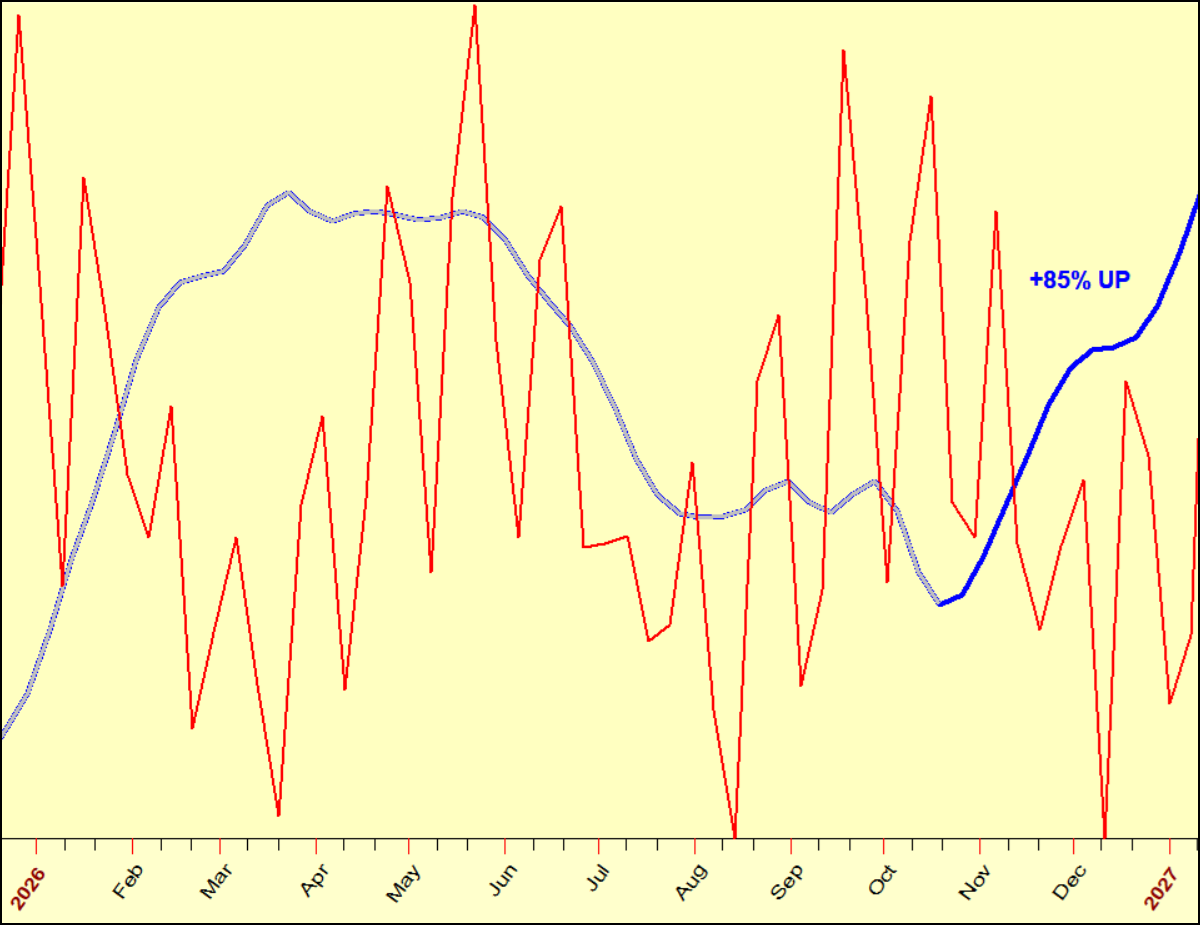
Figure 6: My 2026 COST Forecast
In my Forecast 2026 Report you will see forecasts just like the Costco example in Figure 6. The intermediate-term cycles are shown in red, and long-term cycles are in blue. These roadmaps reveal major market turns well in advance. My report has this level of detail for all the actively traded futures, stock indexes, currencies, Bitcoin, and 60 US stocks (listed below).
These forecasts are un-hedged, direct, and simple to follow. The blue line highlights the most reliable periods for rallies and declines. Historically, Costco has rallied 85% of the time during this long-term cycle wave, giving you clear insight that can dramatically improves your investment focus and success.
Some of you may recall, in November of 2023 I used my cycle analysis to successfully forecast a buy point in COST live on Mad Money, 300 points below the market.
I reviewed last year’s forecasts, well over 70 markets. 76% of the major moves aligned with the blue-line timing. That’s an extraordinary advantage.
Yes. You can know what’s coming.
The 2026 Forecast Report is over 100 pages, yet every projection is concise and actionable. You will see my forward-looking analysis for the S& P E-minis, DJIA, bonds, precious metals, grains, softs, all major currencies, global stock markets, and 60 of the most active individual stocks.
Early in 2025, major firms—Morgan Stanley, Bank of America, Lee Cooperman, Rich Dad/Poor Dad’s author, and many others—predicted a recession or a bear market. Two of the largest research houses even called for a 30% decline.
My readers knew better. I showed exactly why the timing wasn’t right.
A recession is coming—of that I am certain. But the key is when.
You will be told the exact timing and the underlying reason for this call. Use it for your business, your investments, and your personal financial protection. This one insight alone is worth thousands.
Many forecasters misuse cycles and blow up because they don’t understand the nuances. This year I explain their mistakes—and show you the correct way to use cycles for real-world trading and investing.
In 2022 I nailed the inflation peak. Last year I projected a rebound, which we are now seeing. So what happens next?
Cycles point to another rise—soon. You’ll see exactly when I expect inflation to return and how it historically interacts with stock prices (in a way the “experts” never mention).
Around the 15th of each month the Fed releases a little-known indicator that has always peaked at the start of recessions—data going back to 1920.
You’ll see its impact on stocks and the powerful cycle behind it, which has an incredible record of calling major bull and bear markets.
Last year I correctly forecast falling real-estate prices and a buyer’s market. The 2026 outlook shows a meaningful shift you need to be prepared for.
You will learn the most profitable days of the week, month, and year to trade Gold, Bonds, and the S&P Emini—a treasure trove of high-value trades on its own.
Plus, three specific, easy-to-follow setups:
My long-term Panic Indicator flashed major buy signals on March 20, 2020 and June 17, 2022—exactly when most were telling you to sell. Both turned out to be outstanding buying opportunities.
If another major buy—or sell—signal appears in 2026, subscribers will be notified free of charge. Consider it your built-in insurance policy.
Many annual forecasts cost $1,000 for just one market. Some charge $500 for vague commentary. One so-called forecaster is asking $100 per market.
This report includes over 100 market forecasts—but you won’t pay anywhere near $10,000.
We’re holding the price at only $199 until January 15th to give you the highest-value forecast at the best possible price. The report is $249 after January 15th, still a great value.
In addition to extensive research, I actively trade the markets—so I don’t have time to sell this report all year. I want to get back to trading.
Sale ends January 31, 2026 at Noon Eastern.
Not Pacific.
Not midnight.
Noon.
After that, purchases are closed. Every year, people try to buy after the cut-off—and every year, we turn them away.
Click below and in minutes you’ll have the full report—and the clarity to navigate 2026 with confidence.
Good Luck and Good Trading,
— Larry Williams
There are no reviews yet.
From multipurpose themes to niche templates


You must be <a href="https://wislibrary.net/my-account/">logged in</a> to post a review.