


Advanced Power BI Case Study Overview
In this course, you’ll learn advanced techniques for Power BI that will help you create sleek and professional dashboards from start to finish. Over this course, you’ll be applying these techniques directly to several different retail data sets. First, with a set of existing dashboards which you’ll then enhance with better visuals and an improved user experience. You’ll then dive into Power Query; after reviewing the standard method for combining files in a folder, you’ll use those elements to create an advanced combine from a blank query. From there, you will continue with some exploration of dynamic elements in visuals, such as user-controlled legends, colors, axes, and levels of hierarchy. You will also be working with a financial statement Power BI report, which you’ll enhance with artificial intelligence as a way to get deeper insights from the data more quickly. And finally, we’ll look at three ways to integrate Python into Power BI to extend its capabilities. By the end of this course, you’ll be extremely comfortable executing complex tasks in Power BI. You’ll have a deeper understanding of the more advanced aspects of this powerful tool, which you can use to build world-class dashboards more efficiently and with greater flexibility.
Upon completing this course, you will be able to:
This course is perfect for anyone who would like to take their Power BI and DAX skills to the next level by exploring practical business cases. There is no better way to kick-start a career in data analysis, quantitative analysis, business intelligence, or other areas of finance with applied, practical knowledge of Power BI and related BI tools.
Recommended courses to complete before taking this course.
Course Introduction – Advanced Power BI
Learning Objectives
Review Power BI Fundamentals
Student Files Overview
Download Student Files
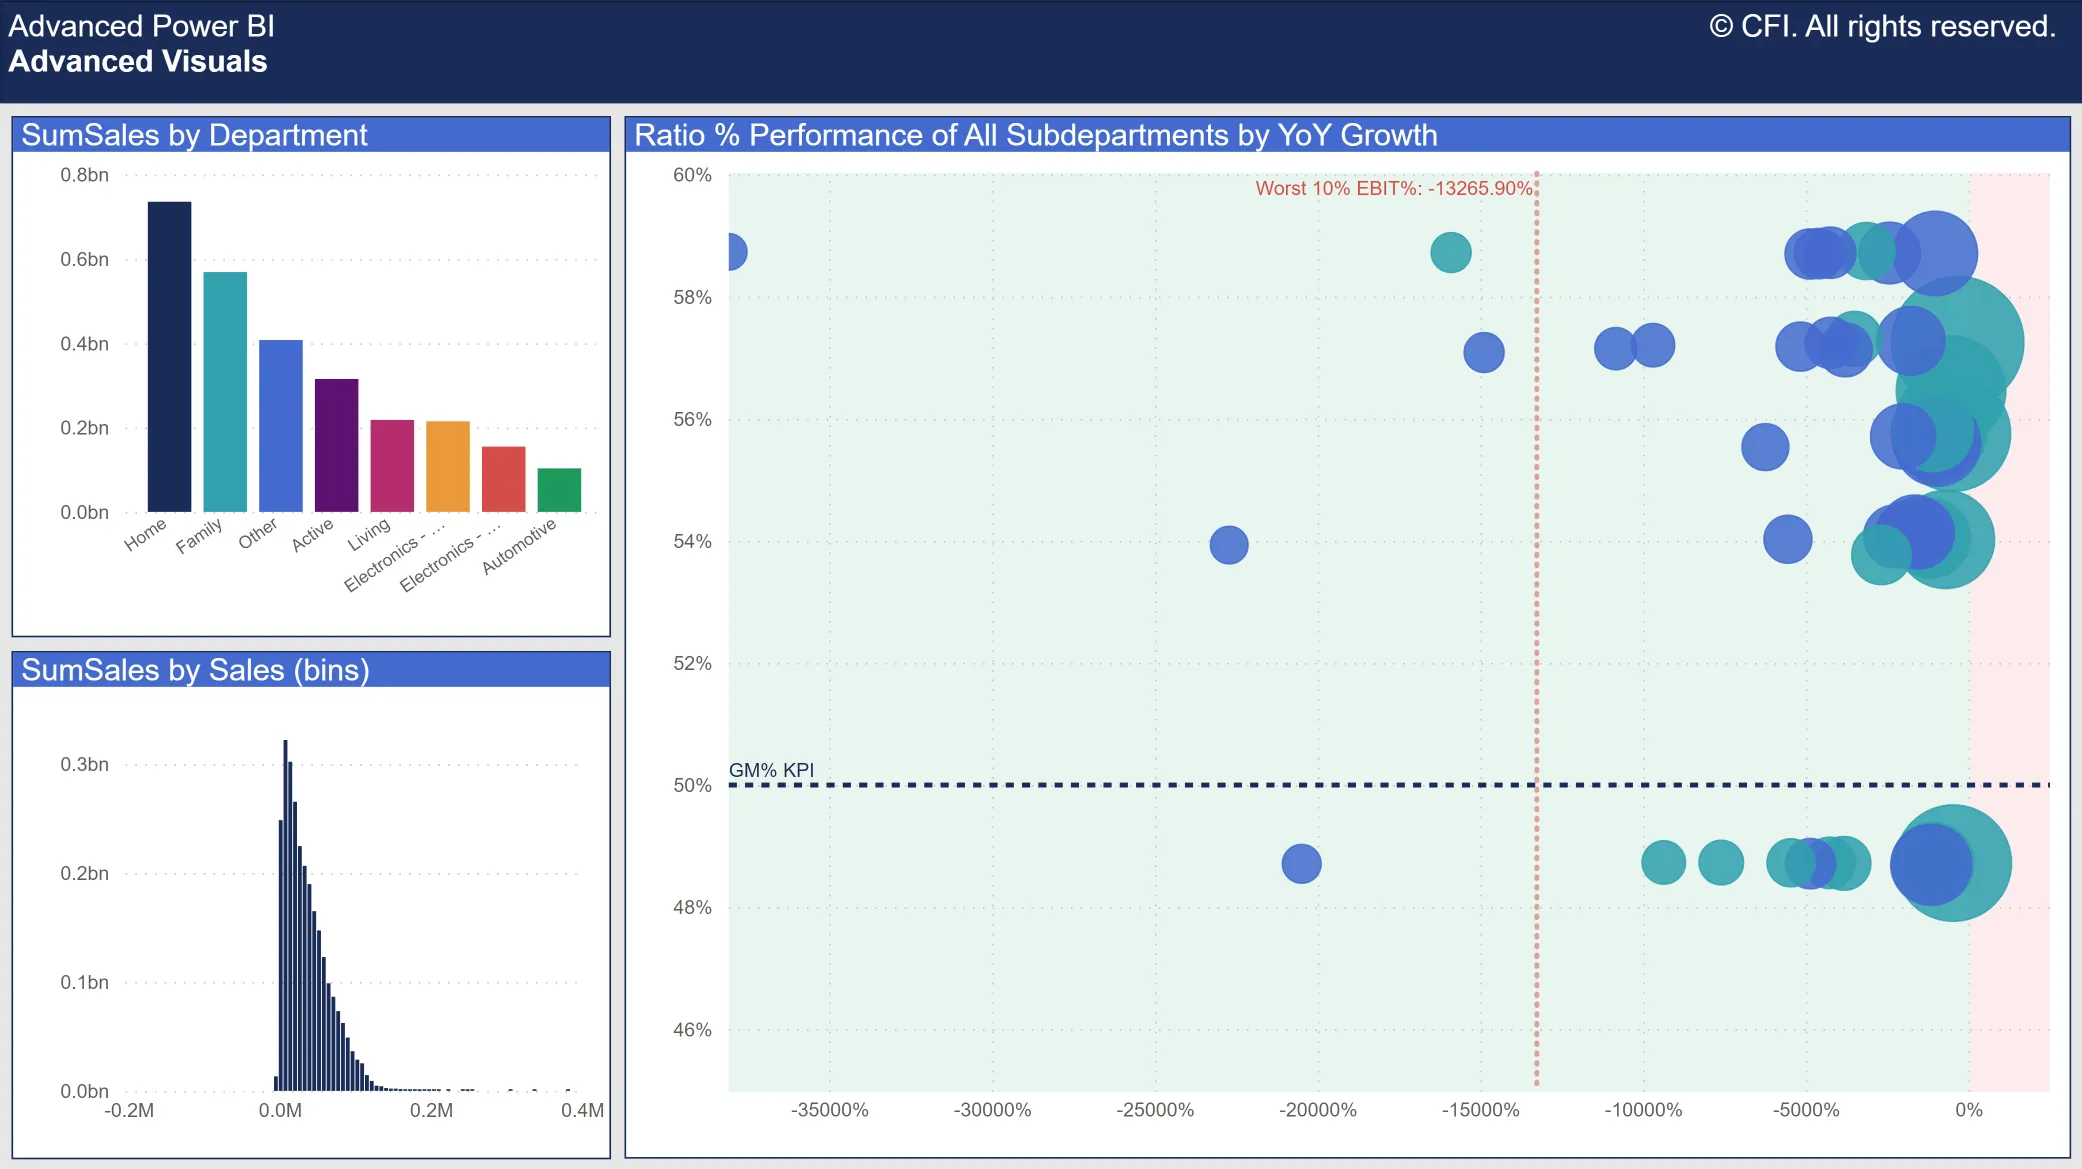
Chapter Introduction – Advanced Visuals
Group Categorical Data for Visualization
Bin Numeric Data for Analysis
Create Visual Formatting with Formulas
Add Dynamic Titles to Visuals
Explore the Analytics Pane
Create a Custom Tooltip Report Page
Build & Format a Custom Tooltip
Link a Custom Tooltip to a Visual & Measure
Create a Custom Visual with Charticulator
Chapter Review – Advanced Visuals
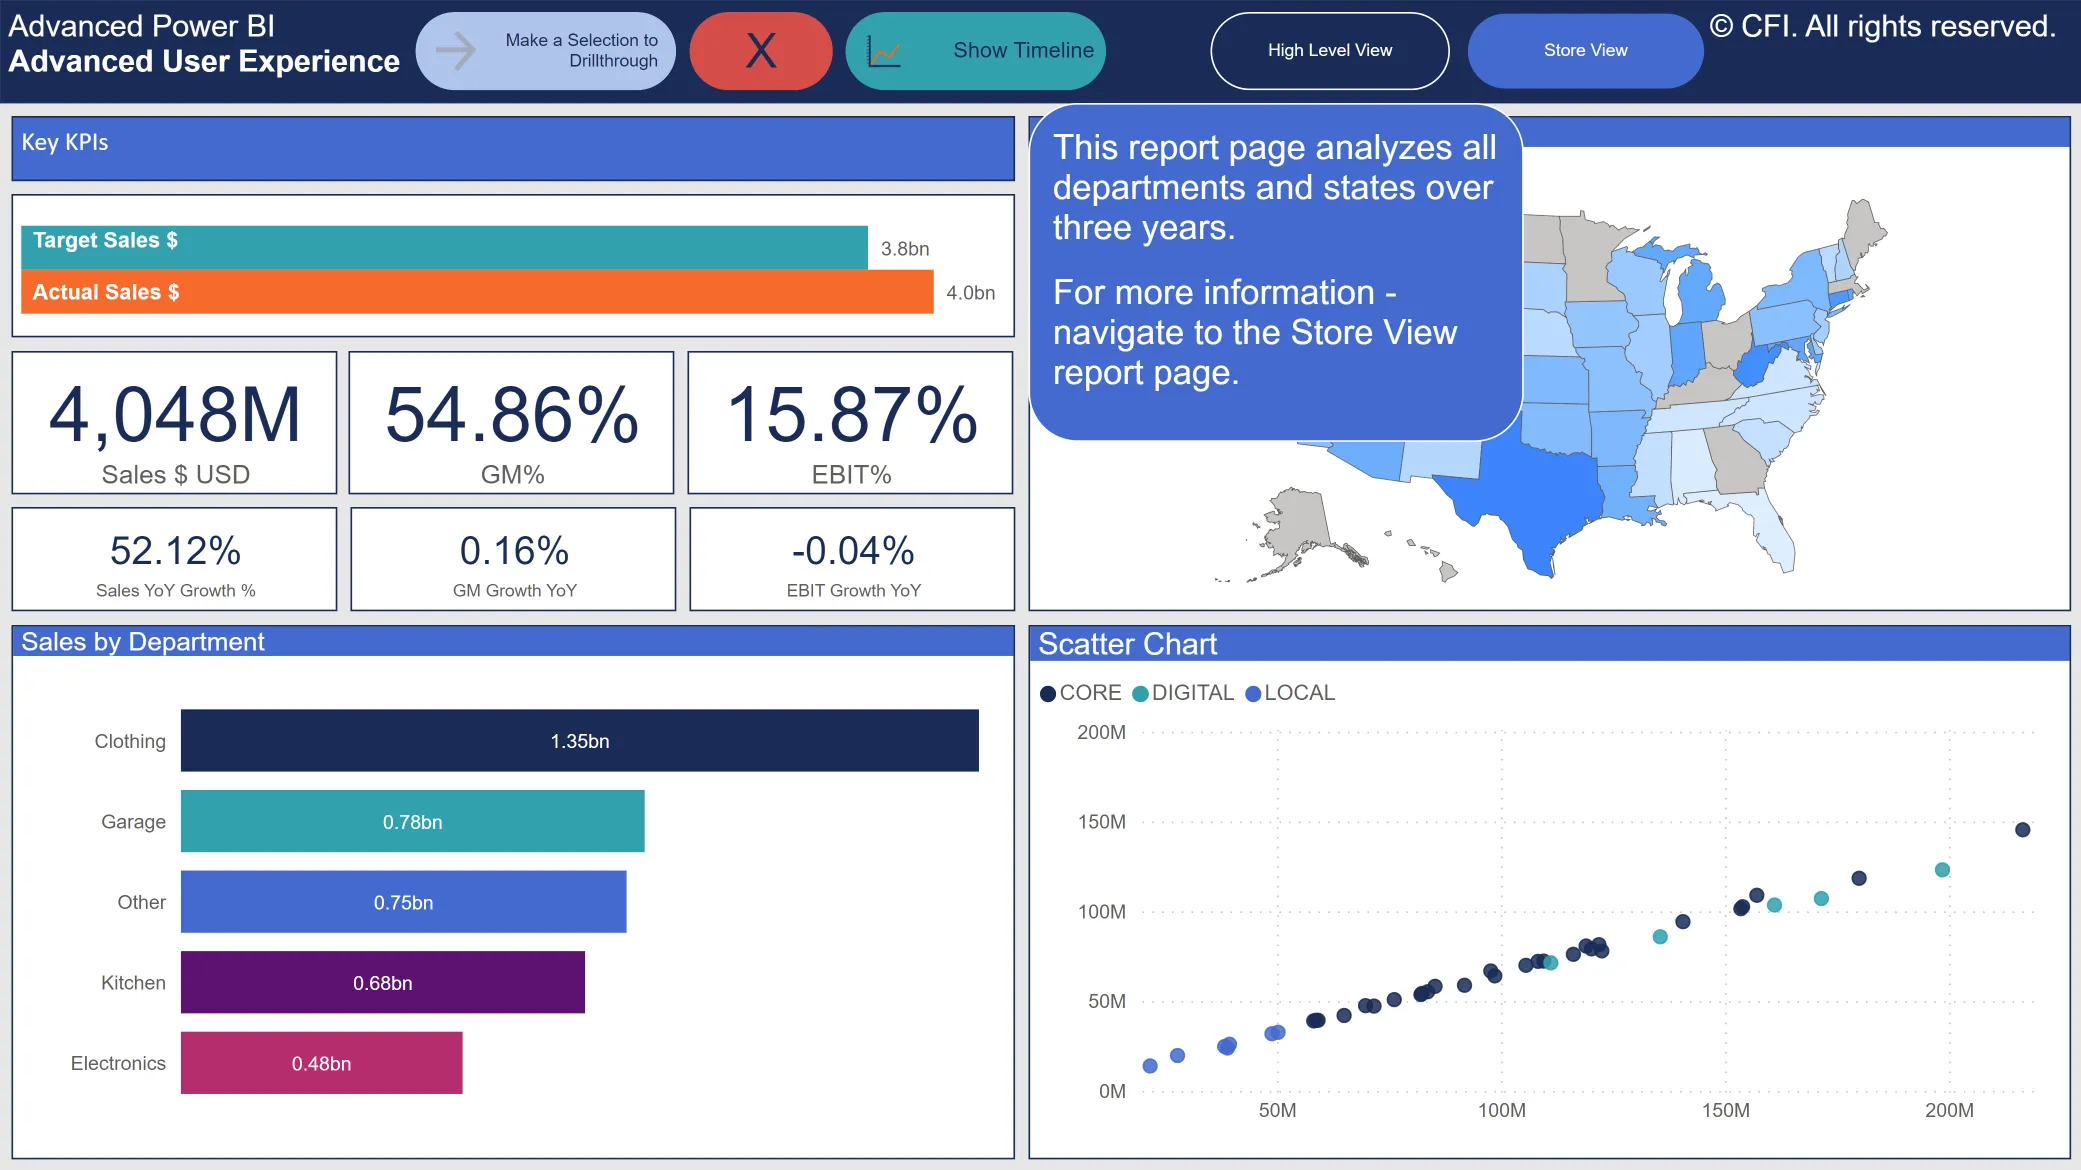
Chapter Introduction – Advanced User Experience
Create Report Drillthrough
Apply Filters to Report Drillthrough
Create and Format Buttons
Configure Buttons with Actions
Create Report Page Bookmarks
Configure Bookmarks – Data & Display
Configure Bookmarks – Selection Pane & Current Page
Configure Bookmarks – Selected Visuals
Build a Bookmark Slideshow
Assign Bookmarks to Buttons
Assign Drillthrough to Buttons
Advanced User Experience Use Case
Chapter Exercise – Create a State Analysis
Chapter Exercise Review – Create a State Analysis
Chapter Review – Advanced User Experience
Course Check-in
Chapter Introduction – Advanced Power Query
Review Combine Files from Folder
Review Combine Files from Folder Detail
Review Combine Files from Folder in Power BI
Build Combine Files from Folder
Custom Combine Files from Folder
Rebuild Combine Files from Folder
Running Totals & Grouped Indexes
Create a Grouped Index
Create a Running Total
Create a Running Total within a Grouped Index
Chapter Review – Advanced Power Query
Chapter Introduction – Advanced Data Modeling & DAX
Build Dynamic Elements in Visuals
DAX Functions for Advanced Data Modeling
Build the Visual Dimension
Create the Visual Measure with CROSSFILTER()
Build a Multi-Relationship Visual Dimension
Create the Visual Measure with USERELATIONSHIP()
Build a Dynamic Disconnected Visual Dimension
Create the Visual Measure with CONTAINSSTRING()
Build Visuals with Other Dynamic Elements
Create Dynamic Date Hierarchy Drill
Create Dynamic Metric Selection
Advanced Data Modeling & DAX Use Case
Create the Filter Dimension in Power Query
Relate the Filter Dimension in the Data Model
Create the Category – Filter DAX Measures
Update the Report Visuals
Chapter Exercise – Update the Scatter Chart
Chapter Exercise Review – Update the Scatter Chart
Chapter Review – Advanced Data Modeling & DAX
Course Check-In
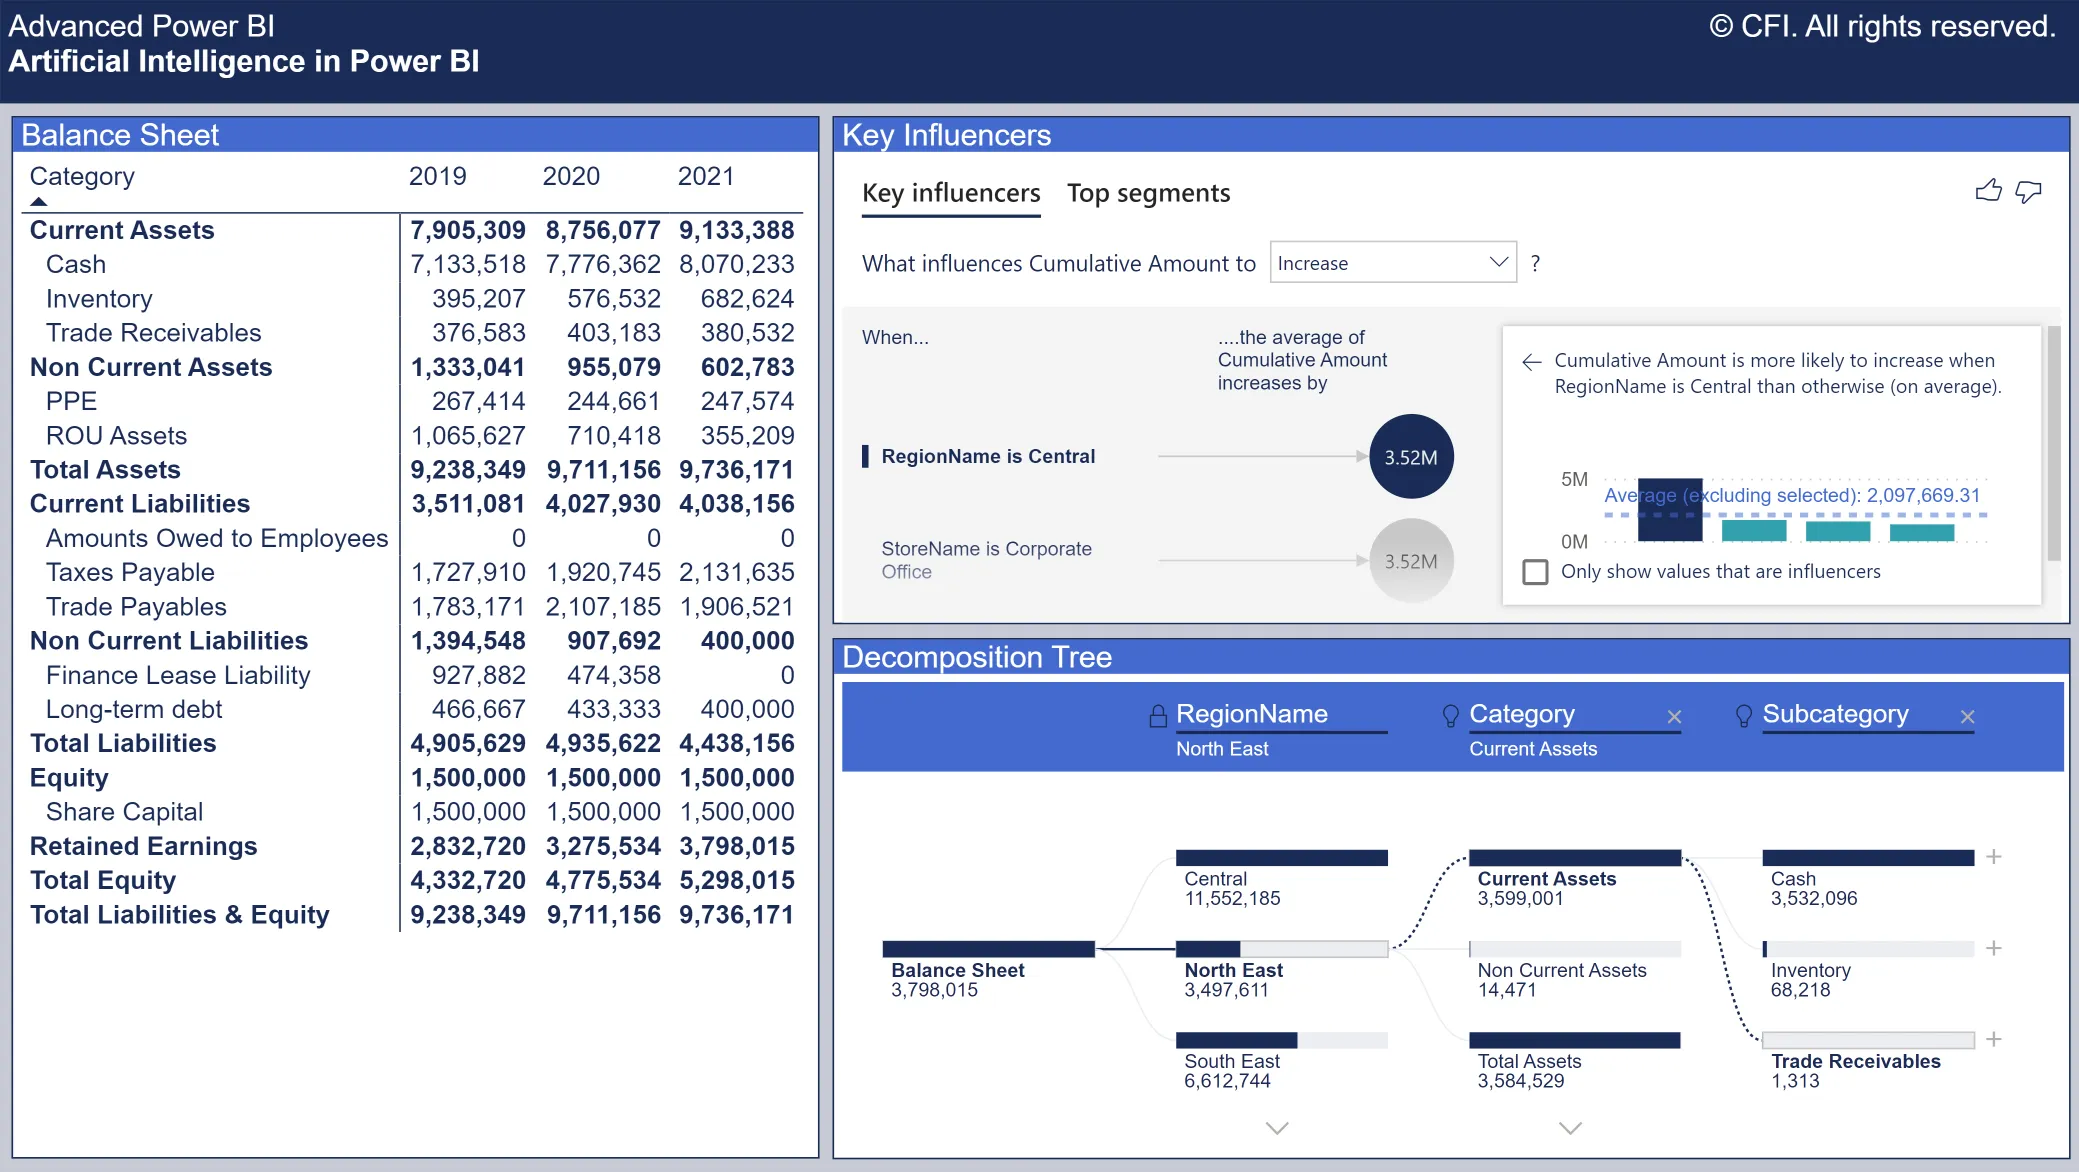
Chapter Introduction – Artificial Intelligence in Power BI
Generate a Summary with a Smart Narrative
Create a Q&A Visual
Configure the Q&A Visual
Analyze to Explain the Increase or Decrease
Identify the Key Influencers of the Balance Sheet
Examine the Balance Sheet with a Decomposition Tree
Detect Anomalies in the Current Ratio
Forecast Future Values of the Quick Ratio
Generate Insights in Power BI Service
Chapter Review – Artificial Intelligence in Power BI
Chapter Introduction – Python Integration in Power BI
Download & Connect Python to Power BI
Create Data with a Python Script
Import External Data with Python
Run a Python Script in Power Query
Create a Visual with Matplotlib
Machine Learning with Python in Power BI
Load & Inspect the Iris Dataset
Reshape Iris to a DataFrame
Build a Classification Model
Update the Classification Model in Power Query
Visualize Classification Model with a Decision Tree
Chapter Review – Python Integration in Power BI
Course Wrap-up – Advanced Power BI
Advanced Power BI Qualified Assessment
There are no reviews yet.
From multipurpose themes to niche templates


You must be <a href="https://wislibrary.net/my-account/">logged in</a> to post a review.